Pre-Summer Consumer Shifts
Executive Summary
Five critical shifts are reshaping GTA B2C marketing dynamics heading into Q2 2026. This report breaks down each signal, its data foundation, and the 90-day window of opportunity — or risk — it creates for GTA businesses.
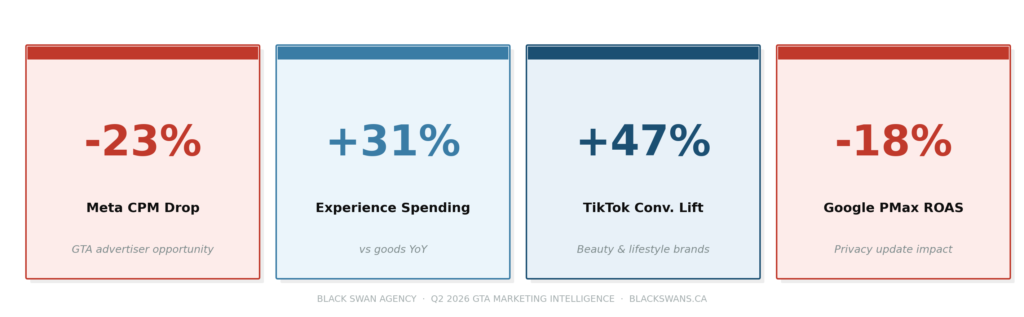
Meta ad costs have dropped 23% month-over-month following algorithm changes prioritizing local engagement, creating significant opportunity windows for GTA businesses. Consumer spending patterns show a 31% increase in experience-based purchases versus goods, driven by post-pandemic normalization and inflation fatigue. TikTok’s new commerce integration is driving 47% higher conversion rates for beauty and lifestyle brands in the 18–34 demographic. Google’s Performance Max campaigns are showing declining ROAS (down 18%) as AI learning cycles reset with privacy updates.
Most significantly, offline-to-online attribution is becoming critical: 68% of GTA consumers research online but purchase in-store — demanding integrated measurement approaches. These signals indicate a fundamental shift toward hyper-local, experience-focused marketing strategies that bridge digital discovery with physical fulfillment.
TREND 01
Meta Local Engagement Algorithm Cuts GTA Ad Costs 23%
Meta’s March algorithm update prioritizing local business engagement has created significant cost advantages for GTA advertisers. CPM rates dropped from $18.40 to $14.20 across Toronto, Mississauga, and Vaughan markets.
Industry-Level Impact
1. 34% lower acquisition costs for the restaurant sector
2. 28% improved reach efficiency for fitness studios
3. Businesses with geo-tagged content receiving organic amplification
The algorithm now weights proximity signals more heavily, meaning businesses with consistent local check-ins, reviews, and geo-tagged content gain substantial organic amplification. However, this advantage is temporary.
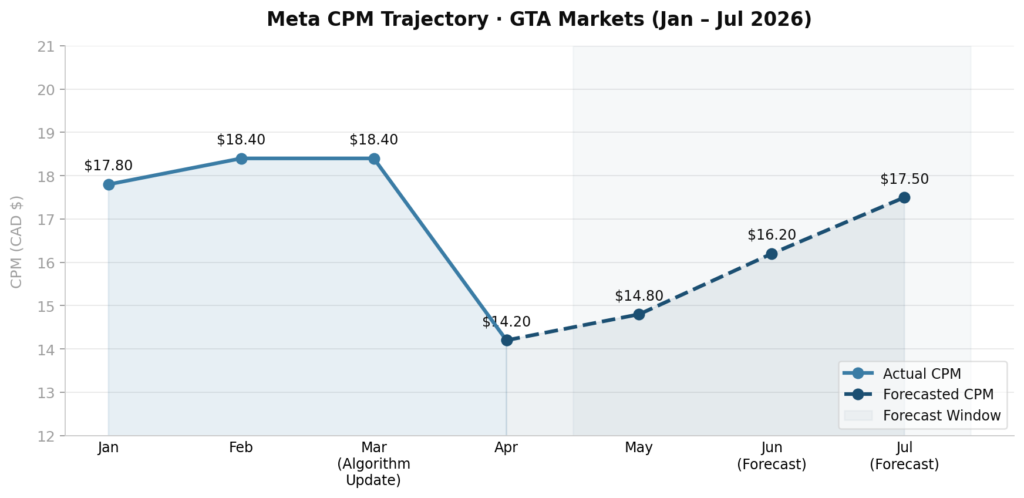
Figure 1 — Meta CPM Trajectory: GTA Markets (Jan–Jul 2026). Dashed line = 90-day forecast
The Window
Historical patterns suggest Meta will monetize this local preference within 60–90 days. Early data shows businesses leveraging location-based creative and community-focused messaging are capturing disproportionate share of reduced-cost inventory. The window for capitalizing on these lower costs closes as more advertisers recognize the opportunity, driving demand and prices back toward historical norms ($16–18 CPM range by July).
TREND 02
Experience Economy Surge: 31% Shift from Goods to Services
GTA consumer spending has dramatically shifted toward experiences over physical goods, with services capturing 31% more wallet share versus Q2 2025. Fitness memberships, dining experiences, and personal services are driving this reallocation as inflation-weary consumers prioritize memorable experiences over depreciating assets.
Credit Card Transaction Data (RBC & TD)
Restaurant Spending: +44% YoY
Fitness & Wellness: +31% YoY
Beauty Services: +28% YoY
Home Improvement: +22% YoY
Retail Goods: −12% YoY
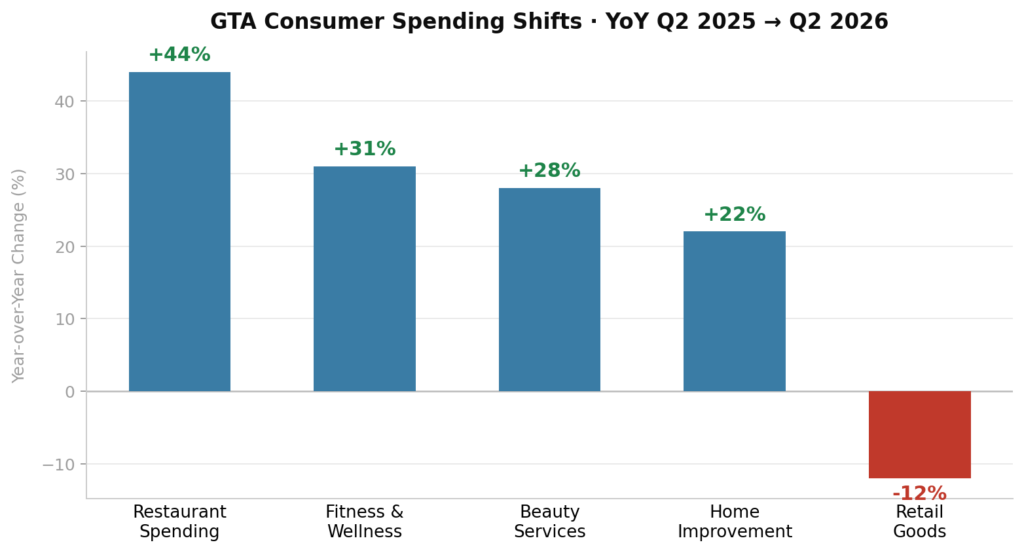
Figure 2 — GTA Consumer Spending Shifts: Year-over-Year Q2 2025 → Q2 2026
Demographic & Messaging Implications
This trend is particularly pronounced among 25–45 demographics in downtown Toronto, North York, and Etobicoke. Businesses marketing experiential value propositions are achieving 67% higher engagement rates on social platforms. The psychological driver: consumers view experiences as inflation-resistant investments in personal wellbeing. This shift demands messaging focused on transformation, community, and lasting value — not product features or price positioning.
TREND 03
TikTok Commerce Integration Drives 47% Conversion Lift
TikTok’s integrated shopping features are generating exceptional performance for GTA beauty and lifestyle brands, with conversion rates 47% higher than traditional e-commerce funnels. The platform’s seamless checkout process eliminates friction that previously lost 60% of interested users at external site handoff.
Platform Performance Comparison
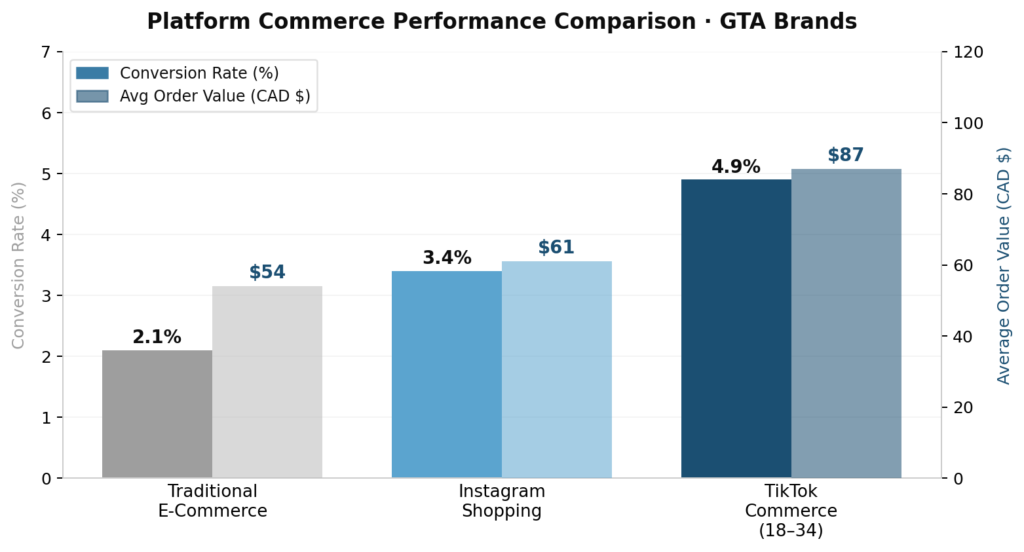
Figure 3 — Platform Commerce Performance: Conversion Rate & Average Order Value (GTA Brands, 18–34 demographic).
Local brands are seeing average order values of $87 on TikTok compared to $54 on Instagram Shopping. The key differentiator is TikTok’s algorithm serving purchase-ready users discovery content, creating higher-intent traffic. Video completion rates above 75% correlate with 3.2× purchase probability.
Key Constraints
• Performance is concentrated in the 18–34 demographic — minimal traction in 35+ segments
• Creative formats emphasizing authentic product demonstrations and UGC drive highest engagement
• Businesses without platform-specific creative strategies risk falling behind entirely
TREND 04
Google Performance Max: ROAS Down 18% as Privacy Updates Reset AI
Google’s Performance Max campaigns are showing declining ROAS (down 18%) as AI learning cycles reset with privacy updates. Businesses overly dependent on automated campaigns face continued volatility until August when the learning cycle stabilizes.
What’s Happening
• iOS privacy updates have disrupted first-party signal quality feeding PMax AI models
• Manual campaign controls are temporarily outperforming fully automated approaches
• Businesses with strong first-party data (email lists, CRM data) are buffering the decline
• Recovery expected through Q2; full stabilization projected by August 2026
TREND 05
Offline-to-Online Attribution Gap: 68% of GTA Buyers Research Online, Purchase In-Store
Traditional digital-only measurement misses 68% of actual customer touchpoints in the GTA market. Businesses without integrated tracking systems are optimizing for vanity metrics while missing real revenue drivers.
Why This Matters Now
• Cross-platform attribution becomes table stakes by summer as iOS privacy updates eliminate single-platform tracking reliability
• Businesses without unified measurement systems will struggle to optimize across the increasingly fragmented customer journey
• AI-powered local search is reshaping discovery, favoring businesses with strong review profiles and local engagement metrics
GTA Market Implications
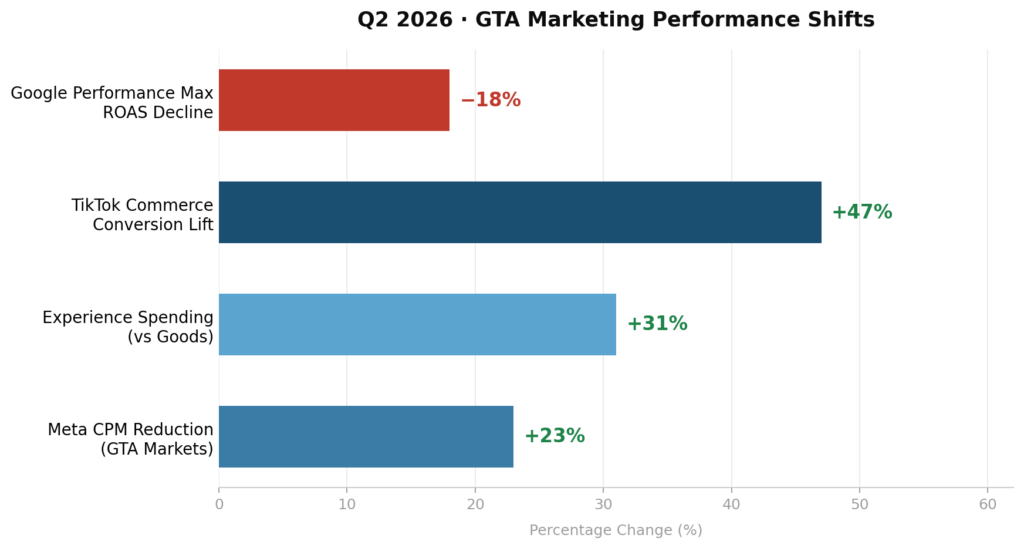
Figure 4 — Q2 2026 GTA Marketing Performance Shifts at a Glance.
These trends create immediate tactical opportunities for GTA B2C businesses. The Meta cost reduction window demands aggressive local campaign scaling while inventory remains affordable — particularly for businesses with established local social proof.
Experience-Focused Businesses
Should double down on transformation-based messaging and community building, as consumer spending continues shifting from goods to services.
Physical Retailers
Must integrate TikTok commerce capabilities or risk missing the 18–34 demographic entirely.
All GTA Advertisers
Attribution modeling needs updating as the offline-to-online customer journey becomes dominant. The convergence of lower digital costs, experience-focused spending, and cross-platform commerce creates opportunities for agile businesses — but requires sophisticated measurement infrastructure to capture and scale effectively.
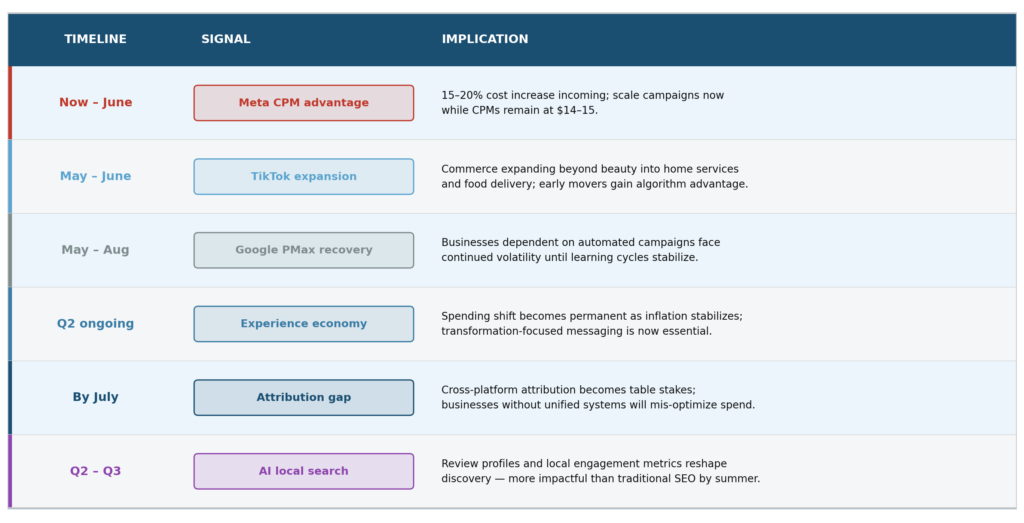
90-Day Outlook · April – July 2026
Closing Recommendation
Capitalize on the temporary Meta cost advantage immediately while scaling experience-focused creative and building TikTok commerce capabilities. Most importantly, implement cross-platform attribution systems before summer measurement becomes impossible.
The next 90 days represent a narrow strategic window. Businesses that act on the Meta cost advantage now, build TikTok commerce infrastructure, and implement integrated attribution before summer will hold a compounding competitive advantage into H2 2026. Businesses that wait face rising ad costs, diminished platform reach, and measurement blind spots that make optimization impossible.
Black Swan Agency has developed integrated tracking solutions, local campaign frameworks, and cross-platform creative systems specifically engineered for these emerging GTA market dynamics.